# !cat page2.csvPage 2 Results
Page 2
Shuffling the results
# !shuf --output=page2.csv <page2.csv# !cat page2.csvSince I ran this notebook more than once, the initial CSV is now completely lost…
Per-question results
Question 0 - preparing data
We will be reading the data here, and processing later..
import csv
import numpy as np

results = []

with open('page2.csv') as csv_file:
    csv_reader = csv.reader(csv_file, delimiter=",")
    for row in csv_reader:
        results.append(list(map(int, row)))

res_array = np.array(results)

print(f"Question 1: c) Scores {res_array[:,:].tolist()}")
Question 1: c) Scores [[5, 7], [3, 10], [5, 7], [2, 10], [3, 10], [5, 10], [5, 6], [4, 4], [5, 5], [3, 7], [3, 10], [3, 10], [3, 10], [2, 10], [3, 5], [3, 2], [3, 10], [2, 10], [3, 7], [3, 5], [5, 7], [2, 7], [1, 8], [2, 2], [4, 10], [2, 6], [3, 10], [4, 7], [3, 10], [2, 2], [1, 10], [3, 2]]import matplotlib.pyplot as plt
def print_stats(A, bins = [x + 0.1 for x in range(-1,6)]):
print(f"Results: {A.tolist()}")
print(f"Mean: {np.mean(A)}")
print(f"Median: {np.median(A)}")
vals, counts = np.unique(A, return_counts=True)
print(f"Mode: {vals[np.argmax(counts)]} With count: {counts[np.argmax(counts)]}")
plt.hist(A, bins = bins, align='right')Question 2
c.
print_stats(res_array[:,:1])Results: [[5], [3], [5], [2], [3], [5], [5], [4], [5], [3], [3], [3], [3], [2], [3], [3], [3], [2], [3], [3], [5], [2], [1], [2], [4], [2], [3], [4], [3], [2], [1], [3]]
Mean: 3.125
Median: 3.0
Mode: 3 With count: 14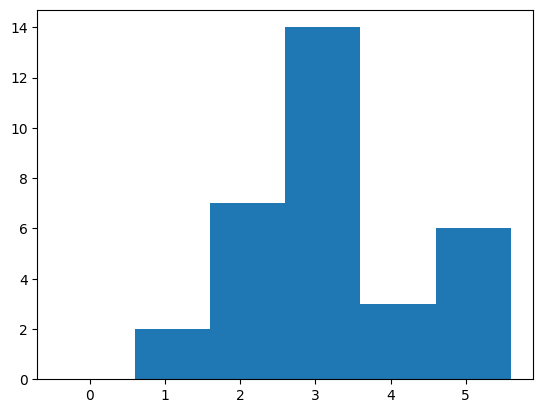
Question 3
print_stats(res_array[:,1:2], bins = [x + 0.1 for x in range(11)])Results: [[7], [10], [7], [10], [10], [10], [6], [4], [5], [7], [10], [10], [10], [10], [5], [2], [10], [10], [7], [5], [7], [7], [8], [2], [10], [6], [10], [7], [10], [2], [10], [2]]
Mean: 7.375
Median: 7.0
Mode: 10 With count: 14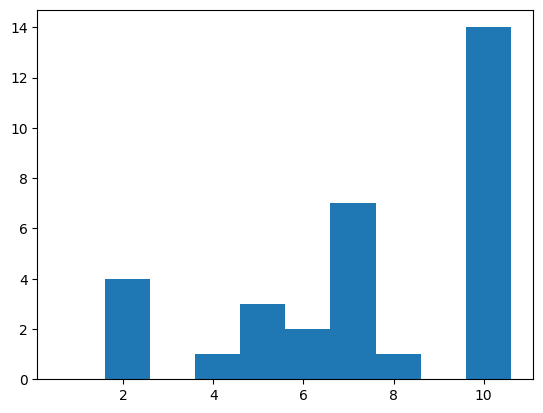
Page results
print_stats(res_array, bins = [x + 0.1 for x in range(11)])Results: [[5, 7], [3, 10], [5, 7], [2, 10], [3, 10], [5, 10], [5, 6], [4, 4], [5, 5], [3, 7], [3, 10], [3, 10], [3, 10], [2, 10], [3, 5], [3, 2], [3, 10], [2, 10], [3, 7], [3, 5], [5, 7], [2, 7], [1, 8], [2, 2], [4, 10], [2, 6], [3, 10], [4, 7], [3, 10], [2, 2], [1, 10], [3, 2]]
Mean: 5.25
Median: 5.0
Mode: 3 With count: 14
print_stats(np.sum(res_array, axis=1), bins = [x + 0.1 for x in range(7,16)])Results: [12, 13, 12, 12, 13, 15, 11, 8, 10, 10, 13, 13, 13, 12, 8, 5, 13, 12, 10, 8, 12, 9, 9, 4, 14, 8, 13, 11, 13, 4, 11, 5]
Mean: 10.5
Median: 11.5
Mode: 13 With count: 8
After scaling
f = lambda x: x + (15 - x) / 2

print_stats(f(np.sum(res_array, axis=1)), bins = [x + 0.1 for x in range(7,16)])
Results: [13.5, 14.0, 13.5, 13.5, 14.0, 15.0, 13.0, 11.5, 12.5, 12.5, 14.0, 14.0, 14.0, 13.5, 11.5, 10.0, 14.0, 13.5, 12.5, 11.5, 13.5, 12.0, 12.0, 9.5, 14.5, 11.5, 14.0, 13.0, 14.0, 9.5, 13.0, 10.0]
Mean: 12.75
Median: 13.25
Mode: 14.0 With count: 8