# !cat totals.csvTotal Results Summary
Shuffling the results
# !shuf --output=totals.csv <totals.csv# !cat totals.csvimport csv
import numpy as np
results = []
with open('totals.csv') as csv_file:
csv_reader = csv.reader(csv_file, delimiter=",")
for row in csv_reader:
results.append(list(map(int, row)))
res_array = np.array(results)import matplotlib.pyplot as plt
def print_stats(A, bins = [x + 0.1 for x in range(-1,6)]):
print(f"Results: {A.tolist()}")
print(f"Mean: {np.mean(A)}")
print(f"Median: {np.median(A)}")
vals, counts = np.unique(A, return_counts=True)
print(f"Mode: {vals[np.argmax(counts)]} With count: {counts[np.argmax(counts)]}")
plt.hist(A, bins = bins, align='right')Total Results
print_stats(res_array[:,:], bins = [x + 0.1 for x in range(30,56)])Results: [[47], [51], [36], [50], [51], [44], [30], [43], [47], [46], [48], [40], [37], [36], [32], [47], [24], [51], [35], [38], [32], [43], [50], [49], [44], [48], [45], [49], [38], [51], [48], [46]]
Mean: 43.0
Median: 45.5
Mode: 51 With count: 4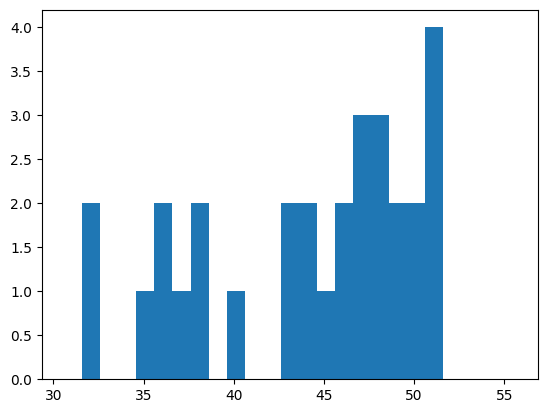
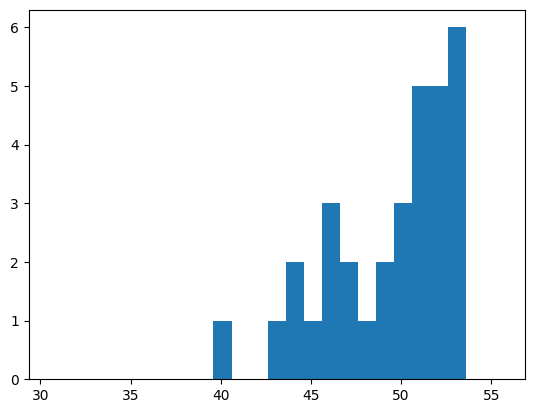
After scaling
f = lambda x: x + (55 - x) / 2

print_stats(f(np.sum(res_array, axis=1)), bins = [x + 0.1 for x in range(30,56)])
Results: [51.0, 53.0, 45.5, 52.5, 53.0, 49.5, 42.5, 49.0, 51.0, 50.5, 51.5, 47.5, 46.0, 45.5, 43.5, 51.0, 39.5, 53.0, 45.0, 46.5, 43.5, 49.0, 52.5, 52.0, 49.5, 51.5, 50.0, 52.0, 46.5, 53.0, 51.5, 50.5]
Mean: 49.0
Median: 50.25
Mode: 53.0 With count: 4